The international scientific and analytical, reviewed, printing and electronic journal of Paata Gugushvili Institute of Economics of Ivane Javakhishvili Tbilisi State University
ON THE ISSUE OF DETERMINING THE RELATIONSHIP BETWEEN THE GOVERNMENT SIZE AND ECONOMIC GROWTH
Abstract
The paper dwells on studying the relationship between the government size and economic growth using the mathematical and statistical tools for the post-Soviet countries of a certain group, as well as for Georgia for the period of 2003-2017, based on the World Bank data. In both cases, there have been revealed the the variation in the share of state expenditure in the analyzed period, which is explained by GDP growth rates in the model presented herein.
Keywords: government size; effectiveness; correlation; GDP; expenditure.
Introduction
Over the last half-century, the combined efforts of many governments have been focused on establishing an effective public service. Improvement of the system of public administration, as well as the use of the new management concepts and technologies were very much linked to the use of the effectiveness and performance indicators [Klishch N.,2007:35].
Of particular importance to effective public administration is to combine state management resources and methods with the existing opportunities and risks. Determining the need for public intervention into social and economic life, as well as government size represent one of the main indicators of effective public management.
To assess the effectiveness of public administration, it reasonable to use the well-tested indicator, such as Government Size.
In scientific literature, the following indicators are used for the analysis of “Government Size”:
- The ratio of the number of people employed in the public sector to total number employed people in an economy (%);
- The share of public assets in the country’s total assets (%);
- The share of public investment in total investment in the country (%);
- Public sector output;
- The ratio of public expenditure to Gross Domestic Product (GDP) (%);
- The share of budgetary revenue in GDP (%).
An overview of the various sources revealed that the share of state budget expenditure in GDP (%) is the most commonly used indicator addressing the “Government Size”. It shows what proportion of wealth created by society ("cake") is spent by the State on delivery of goods and services for the satisfaction of social needs. In the present work, we have based on this method (it should be taken into account common pattern - non-economic expenditure (social costs, ecology, defense, security, etc.) can not be directly reflected in economic growth indicators in the short term).
Based on theoretical and empirical research, some researchers (Barro R.J., Armey R., etc.) have developed a curve that suggests that the increase in government expenditure to kind of a tipping point contributes to economic growth, but beyond this point, the economic growth begins to decline. This seems like sensible, as in a Keynesian model, government expenditure stimulates economic growth by rising overall demand (especially in terms od education and infrastructure). However, if the "growth of the state" is permanent and exceeds the private sector, the return begins to decrease and slows economic growth.
In scientific literature, we encounter an ambiguous approach to the size of the relationship between the size of the government and GDP. One part of the scientific establishment believes that there is a negative correlation between them, but on the opinion of the second part, there is a positive correlation between these values.
Of particular importance is study focused on different countries (OSCE and other 60 countries) and covered a 37-year period (1960-1996). In these countries, there was observed the inverse relation between the share of government expenditure in GDP and GDP growth. The 10% growth of the share of government expenditure reduces the country’s economic growth by 1% on average, and if the share of government expenditure exceeds 60%, economic growth decreases by 1.6%. [Gwartney ... 1998: 10]
Let us consider the aforementioned relationship in post-socialist countries. We have selected 10 countries (see Table 1). In general, public administration in post-socialist countries has undergone the radical transformations, and it has been built on such important principles as democracy, legitimacy and transparency. Aspiration of state governing bodies to achieve transparency and clarity for civil society when performing its own functions necessitates a shift of these bodies towards the public governance principles. This, in turn, necessitated the need for institutional transformation, which is taking place in such countries at a varying pace and in a different scenario. Accordingly, public spending and its share in GDP are also different in these countries.
Table 1
Growth of GDP and the share of expenditure in GDP in some post-Soviet
countries in 2010-2015, %[1]
|
# |
Country |
2010 |
2011 |
2012 |
2013 |
2014 |
2015 |
|
1 |
Lietuva |
1.6 |
6 |
3.8 |
3.5 |
3.5 |
2 |
|
|
|
42.3 |
42.5 |
36.1 |
35.5 |
34.6 |
34.9 |
|
2 |
Estonia |
2.3 |
7.6 |
4.3 |
1.9 |
2.9 |
1.7 |
|
|
|
40.5 |
37.4 |
39.3 |
38.5 |
38.4 |
40.2 |
|
3 |
Latvia |
-3.9 |
6.4 |
4 |
2.4 |
1.9 |
3 |
|
|
|
45.5 |
40.5 |
38 |
37.7 |
38.3 |
38.5 |
|
4 |
Russia |
4.5 |
5.3 |
3.7 |
1.8 |
0.7 |
-2.8 |
|
|
|
35.7 |
35.3 |
35 |
35.8 |
38.6 |
34.5 |
|
5 |
6.5 |
7.4 |
7.5 |
7.4 |
6.7 |
6 |
|
|
|
|
26.1 |
27 |
24.6 |
27.7 |
28.4 |
32 |
|
6 |
Belarus |
7.8 |
5.5 |
1.7 |
1 |
1.7 |
-3.8 |
|
|
|
42 |
34.5 |
38.8 |
41.9 |
39.5 |
42.6 |
|
7 |
Kazakhstan |
7.3 |
7.4 |
4.8 |
6 |
4.2 |
1.2 |
|
|
|
22.5 |
21.7 |
22.4 |
20.2 |
22.3 |
23 |
|
8 |
Georgia |
6.2 |
7.2 |
6.4 |
3.4 |
4.6 |
2.9 |
|
|
|
26.4 |
23.8 |
24.8 |
25 |
26.5 |
25.8 |
|
9 |
Azerbaijan |
4.9 |
0.1 |
2.2 |
5.8 |
2 |
1.1 |
|
|
|
31.7 |
34 |
36.6 |
38 |
36.3 |
38.5 |
|
10 |
Armenia |
2.2 |
4.7 |
7.2 |
3.3 |
3.6 |
3.2 |
|
|
|
26.2 |
25 |
22.4 |
23.8 |
24 |
26.4 |
Among the listed countries, by the highest level of government size, there are distinguished Lithuania, Latvia, Estonia, Belarus and Azerbaijan (35-45%). In the Baltic States, as EU member states, this is due to a high European standard for the public sector. With regard to Belarus and Azerbaijan, these states are marked by high share of the public sector, which contributes to a high percentage of public expenditure in GDP.
The data presented in Figure 1 reflect the relationship between the change in government size and the change in economic growth rates. The linear schedule, whose parameters are estimated by least square method, shows that the relationship between the state expenditure in GDP and economic growth in these countries is on inverse nature (see Figure 1).
Figure 1
Trends in the government size and economic development rates
in post-socialist countries
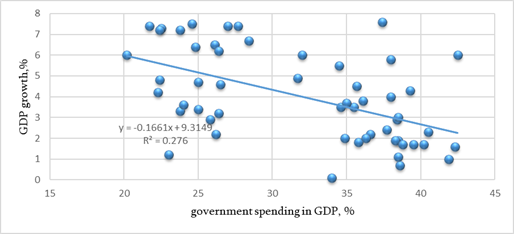
The regressive equation parameters shown in Figure 1 indicate that the increase in the share of public spending in GDP in post-Soviet countries by 10% leads to a decline in GDP growth by 1.8%. The value 0.276 of the R2 coefficient indicates the variation of the share of public expenditure during the analyzed period, which is explained by GDP growth rates in the model presented herein.
The presented regressive equation finds that in the case of 20% of public spending, GDP growth rate is about 6% on average. If public expenditure will be increased, GDP growth rate in the selected countries are forecast to fall. Thus, the existence of a "big country" is a kind of burden for the public, or a tax that will be compensated by low economic growth rates.
Regarding linear regression, it should be taken into consideration that theoretically, the level of public expenditure can be so low that the State will no longer be able to perform its basic functions. In practice, there should be taken into account the specificity and administrative-territorial structure of the country, which will enable us to compare the share of public spending in GDP and GDP growth rates, on the basis of specific calculations.
Government policy in Georgia has always envisaged a reduction in the size of the government in some way, although it often had a declarative character.[2]
In postcommunist Georgia, the government has implemented some cosmetic changes, which has further complicated the existing problem. In 1992-2003, the number of territorial-administrative units was increased and Georgia was divided into nine regions. This has resulted in further bureaucracy and inefficiency in the governance. In 2003-2012, the government renamed the districts and transformed up to 1000 self-governing units into municipalities. With this approach, even small rural communities, slightly larger villages and towns have become new municipalities. During this period, the village councils were abolished and the position of the attorney of administrative unit was established, who was appointed by the head of municipality. He was responsible for coordination with municipality activities.
As a result of the transition of power in 2012, an attempt was made to reform the territorial-administrative structure. In particular, the municipalities and self-governing cities (their number was increased from 5 to 12) received significant administrative and social-economic delegations. It was one more step towards the regional decentralization. However, since 2017, the number of self-governing cities has decreased to 5 again [Rukhadze, 2016: 3].
We share the view that this reform is only partial and incomplete. In particular, too large number of municipalities had to be reduced, as well it was necessary to solve the problem of bureaucracy, which increases budgetary expenditure and reduces the effectiveness of governance.
Bureaucratization is a main source of public spending. As a result of institutional changes that have been implemented since 2004, the number of state institutions has decreased, and some of them have been consolidated. Therefore, it has become necessary to optimize the number of public officials. Within the Public Service Reform, the number of employees in the ministries (in 2004-2005) was reduced from 102571 to 66615 (35%) and the number of employees in subordinate agencies was reduced from 23769 to 8237 (65%).
According to data of the National Statistics Office of Georgia, the number of employees in the public sector in 2007-2017 decreased by 37,5 thousand (from 321.3 thousand to 283,8 thousand people). During the same period, the salaries of employed persons in the public sector increased by 2,74 times, and the wages in the non-public sector increased by 2,26 times. [Geostat ... 2017: 47].
In 2014-2017, the number of employees in the public sector decreased by 16686 people. In 2014-2015, many self-governments were reorganized and optimized, which led to a reduction in the number of staff (see Table 2). The analysis carried out in the regional context reveals that in 2014-2015, reduction of staff in the local self-government bodies of different regions was uneven [Rusadze, 2017: 308.]
Table 2
Number of people employed in the public structures in 2014-2016[3]
Public structure |
2014 |
2015 |
2016 |
2017 |
(+,-) |
|
|
2015/ 2016 |
2016/ 2017 |
|||||
Local government |
14635 |
12646 |
11913 |
9574 |
733 |
2339 |
Governor's Administration |
387 |
272 |
366 |
251 |
-89 |
115 |
total public administration |
63394 |
53109 |
51242 |
46708 |
1867 |
4534 |
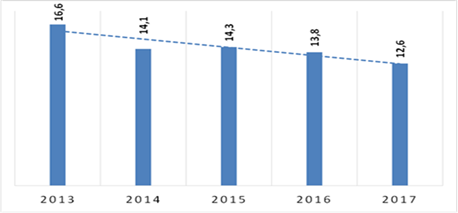
Recent ongoing changes and dynamics are characterized well by the number of public officials per 1000 citizens of the country.
As illustrated in Figure 2, the trend (downward) is positive. However, it should also be taken into consideration that the 2015 data have been obtained by a new indicator of the population census, according to which the population dropped by 777 thousand people, which contributed to the formation of this trend [Rusadze, 2018: 59].
Figure 2
Number of public officials per 1000 citizens of Georgia in 2013-2017
An increase in bureaucracy, low state awareness, nepotism and the so-called "loyalty vertical" to personalities (and not to values) in countries as representative of the size and type of Georgia, contribute to the inefficient nature of public expenditure, access of corrupt individuals to them, possibility of outflows of funds abroad (including offshore). In sum, under conditions of the ruling power force with a low state awareness, the bureaucracy's attempts to lay hands on as much slice of "GDP-cake" as possible unduly and unfairly, lead us inevitably to the reduction in production and distribution efficiency, that is, the deterioration of economic growth indicators [Archvadze, 2002: 54].
Let us consider separately the growth dynamics of Government Size and GDP in Georgia in 2003-2017. Of the events that are characteristic of this period are reference should be made to the following:
- The changes of government (twice);
- The changes aimed at liberalizing taxation legislation;
- Minimization of the shadow economy;
- Signing the Georgia-EU Association Agreement;
- The world economic crisis;
- Georgia-Russia war in August 2008.
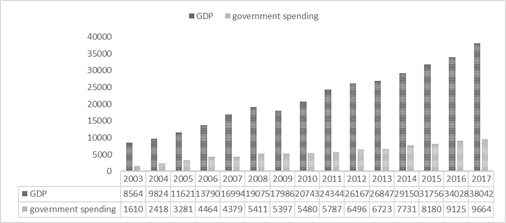
During the analyzed period, GDP increased from GEL 8564 thousand (in 2003) to GEL 38042 thousand in 2017 (by 4,4 times, at current prices)[GeoStat ... 2017: 17]. The process accompanying GDP growth was also naturally increased public spending: against the background of the establishment of state institutions and a decline in corruption, this figure increased from GEL 1610 thousand to GEL 9664 thousand (6 times). Also, the size of the government was growing continuously. In 2003, it made up 18.8%, in 2007 - 25.8% and in 2017 - 25,4%. The average annual GDP growth rate was 5.7%, while the share of public expenditure in GDP made up 26.2% (see Fig. 3).
Figure 3
The evolution of public expenditure in GDP in Georgia in
2003-2017 (mln GEL)
Based on the World Bank data, which we were partially presented in Table 1 (2010-2015), we have analyzed the change in the size of the State and changes in economic development of Georgia in 2003-2017 (see Figure 4). [World Bank, 2018]
Figure 4
The relationship between the changes in the size of the State and change in economic
development of Georgia in 2003-2017
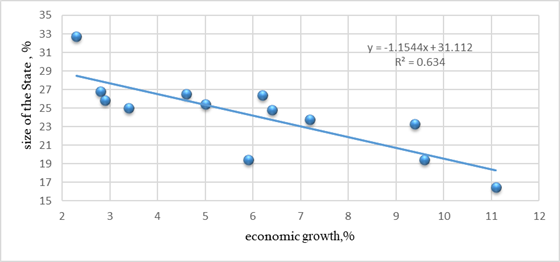
The linear schedule, whose parameters are estimated by least square method, shows that the relationship between the state expenditure in GDP and economic growth in these countries is on inverse nature. The value 0.634 of the R2 coefficient indicates the variation of the share of public expenditure during the analyzed period, which is explained by GDP growth rates in the model presented herein.
There are other studies that are based on revealing the linkage between the share of budget revenues in GDP and the GDP growth rates in Georgia in 2002-2008. The study revealed that: the 1% growth rises the economy by 0.06%, and the 1% growth in budget revenues stimulates the economy by 0.12&, and the 1% growth percent in the capital formation leads to 0.15% growth in the economy [Tabagua, 2009: 11].
Some authors believe that according to 2016-2020 forecasts, based on the IMF figures, reduction in government size by 1% accelerate the economic growth rate by 0.16%. [Beridze, 2016: 43]
In the view of academician V. Papava, when comparing the economic growth indicators of individual countries and regions, the universally recognized problem is the existence of the fast growth effect, because of which, it is virtually impossible to compare these indicators directly to each other. He suggests us, when studying tis problem, to eliminate the fast growth effect, as a result of which, it would be possible to get a more adequate picture [Papava, 2014: 35].
In terms of the size of the government, it is interesting to study and analyze the situation in other countries. We have formulated a list of 12 states that are different in the territorial-administrative structure, but are comparatively by population size. (See Table 3). Table 3 allows for comparing the number of ministries in these countries, considering the ratios to significant macroeconomic indicator, such as GDP.[4] The leader in terms of the number of ministries in this group is Poland (19 ministries), as well as Ukraine and Norway (18 ministries). "Small Governments" have been observed in Hungary, Netherlands and Moldova (8-9 ministries).
Analysis has revealed significant differentiation in the number of ministries per million of inhabitants. As expected, the leaders are the post-Soviet republics: Latvia (6,84), Armenia (5,86) and Georgia (2,56). This figure is also high in Norway, which, despite a high economic level (75245 thousand dollars per capita per population), is explained by small population size.
Table 3
The number of ministries and their ratio to GDP by states
|
State |
The number of ministries |
The number of ministries per million inhabitants |
GDP per ministry (billion $) |
GDP per capita, $ |
|
|
Ukraine |
18 |
0.41 |
6.2 |
2548 |
|
|
Armenia |
17 |
5.86 |
0.7 |
3966 |
|
|
Serbia |
16 |
1.84 |
2.6 |
4759 |
|
|
Belgium |
13 |
1.13 |
37.9 |
42843 |
|
|
Moldova |
9 |
2.25 |
0.9 |
2025 |
|
|
Poland |
19 |
0.50 |
27.6 |
13766 |
|
|
Latvia |
13 |
6.84 |
2.3 |
15947 |
|
|
Norway |
18 |
3.40 |
22.2 |
75245 |
|
|
Georgia |
10 |
2.56 |
1.5 |
3872 |
|
|
Canada |
15 |
0.41 |
110.2 |
44797 |
|
|
Hungary |
8 |
0.82 |
7.0 |
5784 |
|
|
Netherlands |
8 |
0.47 |
103.3 |
48316 |
Interesting results were given by GDP calculated on per ministry in this group of countries. It is still the lowest in the post-Soviet republics: Armenia (0,7), Moldova (0,9) and Georgia (1,5). In this regard, the above mentioned has a relatively high figure - $ 2,3 billion, and its GDP per capita is 7,8 times larger than in Moldova, 4 times than in Armenia, 4,1 times than in Georgia and significantly larger than in Ukraine.
Table 4
The number of parliamentarians per 100 thousand citizens and GDP per capita by states[5]
|
|
State |
The number of parliamentarians |
GDP per capita ($) |
The number of parliamentarians per 100 thousand citizens |
|
1 |
Georgia |
150 |
3872 |
4,02 |
|
2 |
India |
795 |
1581 |
0,06 |
|
3 |
Germany |
631 |
47774 |
0,78 |
|
4 |
Australia |
226 |
61980 |
0,96 |
|
5 |
Belgium |
221 |
42843 |
1,97 |
|
6 |
Azerbaijan |
125 |
7886 |
1,31 |
|
7 |
Ukraine |
450 |
2548 |
0,99 |
|
8 |
Lithuania |
141 |
16489 |
4,81 |
|
9 |
Israel |
120 |
37206 |
1,46 |
|
10 |
Kazakhstan |
154 |
12601 |
0,89 |
|
11 |
Brazil |
594 |
11726 |
0,29 |
|
12 |
Netherlands |
225 |
48316 |
1,33 |
|
13 |
Russia |
450 |
10962 |
0,31 |
|
14 |
Japan |
722 |
38303 |
0,57 |
As for the legislative authorities, we have selected 14 countries, including the developed and developing countries, as well as post-Soviet states. Table illustrates that Georgia is distinguished by a large number of members of the legislative body, as far as on average, 100,000 citizens are served by 4 parliamentarians (see Table 4). In small states, this figure between 1 and 2. Only in Lithuania, it reaches 4,81, although Lithuania's GDP per capita is 4,3 times higher than this indicator in Georgia.
Conclusions
- The existence of a "big country" is a kind of burden for the public, a tax that will be compensated by low economic growth.; the existence of a "big country" is a kind of burden for the public, or a tax that will be compensated by low economic growth rates. Minimizing the role of the State promotes both reducing bureaucracy and cutting taxes required for its feeding;
- It is necessary to minimize the losing/duplicate functions and services of the State, as well as to save a number of processes and procedures by improving organizational performance. Along with reducing costs of public administration, this also reduces business expenditure to State structures and promotes competition;
- Analysis of the number of employed people in post-Soviet countries allows us for concluding that the number of public officials in Georgia in correlation with the number of citizens is characterized by one of the highest figures. This is what points us to the urgent need for the effective use of human resources in public administration;
- When studying the size of the State and a “small government”, in practice, there must be taken into account the specificities and its administrative-territorial structure, which will enable us to compare the share of public expenditure in GDP and the GDP growth rate, based on the concrete calculations;
- It is inadmissible to merge the ministries on the basis of some subjective considerations or decision made by the group of persons without preliminary, thorough study and analysis. To this end, it is necessary to determine the State's optimal size and to “adapt” to it the executive structure of the government;
- When determining the optimal number of ministries, it is necessary to specify and compare the descriptions of the responsibilities and works of each of them. Without this, an effective decision cannot be made.
References:
- Archvadze I., 2002, What color is the billion? – Tbilisi, p.54.
- Beridze G., 2016, Analysis of the effect of government size on economic growth. Journal “Economics and Banking”, V. 4, No 2, p. 43https://www.nbg.gov.ge/uploads/journal/2016/2/III.pdf
- GwartneyJ., Lawson R., Holcombe R., 1998, The Size and Functions of Government and Economic Growth. გვ.10 http://www.civilwarcause.com/relationship/sizefunctiongovt.pdf
- Klishch N., 2007.Indicators of effectiveness and efficiency of professional activities of the state civil servants. – M., SU-HSE, 2007, p. 35.
- National Statistics Office of Georgia. Georgian Statistics yearbook 2017. Tbilisi, 2018. http://geostat.ge/cms/site_images/_files/yearbook/Yearbook_2017.pdf
- National Statistics Office of Georgia. Gross Domestic Product of Georgia – 2017. Tbilisi, 2018.http://geostat.ge/cms/site_images/_files/georgian/nad/Press%20release%20GDP%202017_Geo.pdf
- Papava V. 2014, Fast growth effect and post-crisis economic growth. Journal “Economics and Banking”, V. 2, No 1, p. 35 https://www.nbg.gov.ge/uploads/journal/2014/statia3.pdf
- Rukhadze V., 2016,New territorial and administrative structure of Georgia: high-pressing task of the Georgian state, p. 3 http://www.accentnews.ge/ge/news/details/11693
- Rusadze N. 2017,On the issue of increasing the effectiveness of public administration (territorial aspects). International Scientific-Practical Conference “Globalization and Modern Business Challenges”, Conference Proceedings, GTU, p. 308.
- Rusadze N., 2018, The main way for the improvement of the effectiveness of public administration (by the case of Imereti region). Kutaisi, Ak. Tsereteli State University publishers, p. 59.
- Tabagua S., 2009, The effect of the government size on economic growth (Georgia in 2002-2008). Bureau of Economic Research of Georgia, p.11. http://www.edu.gber.ge/uploads/files_90_1.pdf
- World bank http://databank.worldbank.org
[1] Table was prepared on the basis of the following sources:
http://databank.worldbank.org/data/indicator/NY.GDP.MKTP.KD.ZG/1ff4a498/Popular-Indicators; http://ec.europa.eu/eurostat/tgm/table.do?tab=table&init=1&language=en&pcode=tec00023&plugin=1; http://www.economywatch.com/economic-statistics/economic-indicators/General_Government_Total_Expenditure_Percentage_GDP/;
[2] In 1919, the Prime Minister of England responded to lord, who took an interest in national costumes Georgian delegation members visiting Paris were wearing: "They are from the country that can provide all of Europe with ministers".
[3] Table was prepared on the basis of data provided by Public Service Bureau, according to the reports of 2014-2017 http://csb.gov.ge
[4] We entered in Table the developed and European countries of different sizes, as well as post-Soviet republics (Table was prepared in the basis of the World Bank data) https://data.worldbank.org/indicator/NY.GDP.MKTP.CD; http://www.worldometers.info/world-population/population-by-country/
[5] Table was prepared in the basis of the World Bank data https://data.worldbank.org